Price Action and Forex Robot Nation
- Home
- Blog Large
- Forex Robot Nation
- Price Action and Forex Robot Nation
 Today I’ll be going over Price Action, and the impact this has had on my trading, and those at the Forex Robot Nation community.
The debate about whether technical or fundamental analysis is better has gone on for far too long. I can’t lay rest to it, but I can tell you where I stand in the midst of this battle. I’m a straight up price action, technical analysis guy when it comes to trading. It would be foolish to deny that using fundamental analysis is very advantageous to trading on the financial markets, but I‘m sticking to my guns. I’m not reluctant to admit that announcements of interest rates and other related financial or economic information can and most likely will affect the markets, however where fundamentals fail is where technical traders thrive. I intend to show you exactly how this can be so.
 While fundamental analysis will provide information about what is happening in the world, one must take note that despite the fact that information is released daily about events that happen around the world, not all of them always affect the markets and they don’t happen everyday. In that case, you are constantly waiting for news, and that can be infuriating. There are those types of traders who would wait for the right opportunity to place a trade, based on fundamentals; however those who use technical analysis are constantly searching for opportunities based on price action, but are also likely to take advantage of fundamentals on days where they do apply. This is where automated trading and programs like Forex Steam come in handy. One point to technical analysis.
Furthermore, one cannot precisely predict how buyers and sellers will respond to news that affects the markets. Some traders can guess the general market reaction based on market psychology, but there is always that margin of error to look out for just in case the markets don’t do what they’re supposed to. These are my only two problems with fundamental analysis. I would like to emphasize some aspects of technical analysis that attract me towards using it.
Multi-Time Frame Analysis
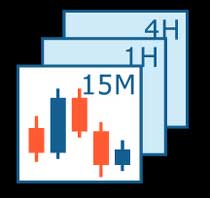
 With multi time frame analysis, you can view price action action charts that span as far back as 1999. Doing analysis, is one of the keys of Forex Robot Nation, and you should be doing this work. That is more than enough data to view how the currency pairs have performed over time, what the overall general trend has been and possibly where the market is headed. I say if the trend has been downward for the past two years, then you can identify it as a long term down trend, but that doesn’t mean the trend can’t change. Multi time frame analysis includes weekly, daily, four hourly, hourly, 30 minute, 15 minute, 5 minute and per minute charts. That gives more than enough information to make hourly to minute to minute decisions with your trading.
Support and Resistance Lines
In my experience trading, your support and resistance lines are of paramount importance to your trading. Once you get those two lines correct on all multi-time frame analysis charts (from monthly to hourly), it’s much easier to see where the chart has been and possible positions you could take. A fellow trader of mine mentioned to me that once you think of support and resistance lines as if they were the ceiling and the floors in a building, with holes that the price action chart is likely to go through and barriers that it probably wouldn’t go through, the imagery makes it easier to perceive the price movement.
Fibonacci Retracements and Expansions
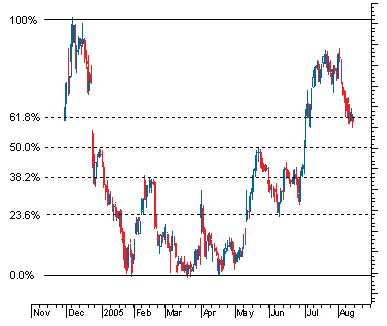
Fractal geometry remains a vital component to trading technical analysis. Which other indicator is more likely to give you other support and resistance lines in addition to you own, as well as most likely places where other traders are most likely to place their positions? Furthermore, when you use your Fibonacci retracement and lines in addition to your support and resistance lines, the area where they overlap the most form a cluster zone, which is where most buyers or sellers are most likely to enter the market.
The Fibonacci papers at Forex Robot Nation are very helpful to the community as well.
Elliot Wave Theory
I’ve warmed up to this theory ever since I heard of it, but that only because it works. Seriously, 8/10 I’ve analyzed the markets and placed trades based on this theory and the pattern is always confirmed. I always like to catch the price action graph right after wave 2 is complete, then I can anticipate wave 3 (the longest wave) but still make profits as the price action chart proceeds to wave 5.
Moving Averages
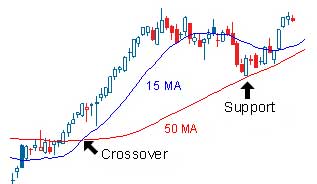
I never used to like this indicator, but it has shown me some interesting over the past month. Whenever the 200 day moving averages crosses the price action chart, a new trend is formed…quote me on that. Furthermore, when the 55 day moving average crosses 200 day moving average, a trend is formed as well. This then gives you the opportunity to take advantage of the new trend and place a trade.
Of course when trading using technical analysis, you do confirm all your tools and indicators before you trade. It is not advisable to place a trade based upon one tool or indicator.
I have been a novice trader for a while now and despite the fact that technical vs. fundamentals is worthy of consideration, if you are a trader or would like to be, in my personal opinion I think you should take advantage of the Forex Robot Nation resource. This is your best bet.


